Data visualization is like a telescope for data. Just as astronomers use telescopes to observe and understand the universe, data scientists use visualizations to explore and comprehend complex datasets. Each chart, graph, and infographic acts as a lens, bringing hidden patterns and insights into focus. Through this lens, we can navigate the vast expanse of data, discovering new knowledge and making informed decisions.
GLOBAL SUPERSTORE SALES ANALYSIS
POWER BI_PROJECT | 2024
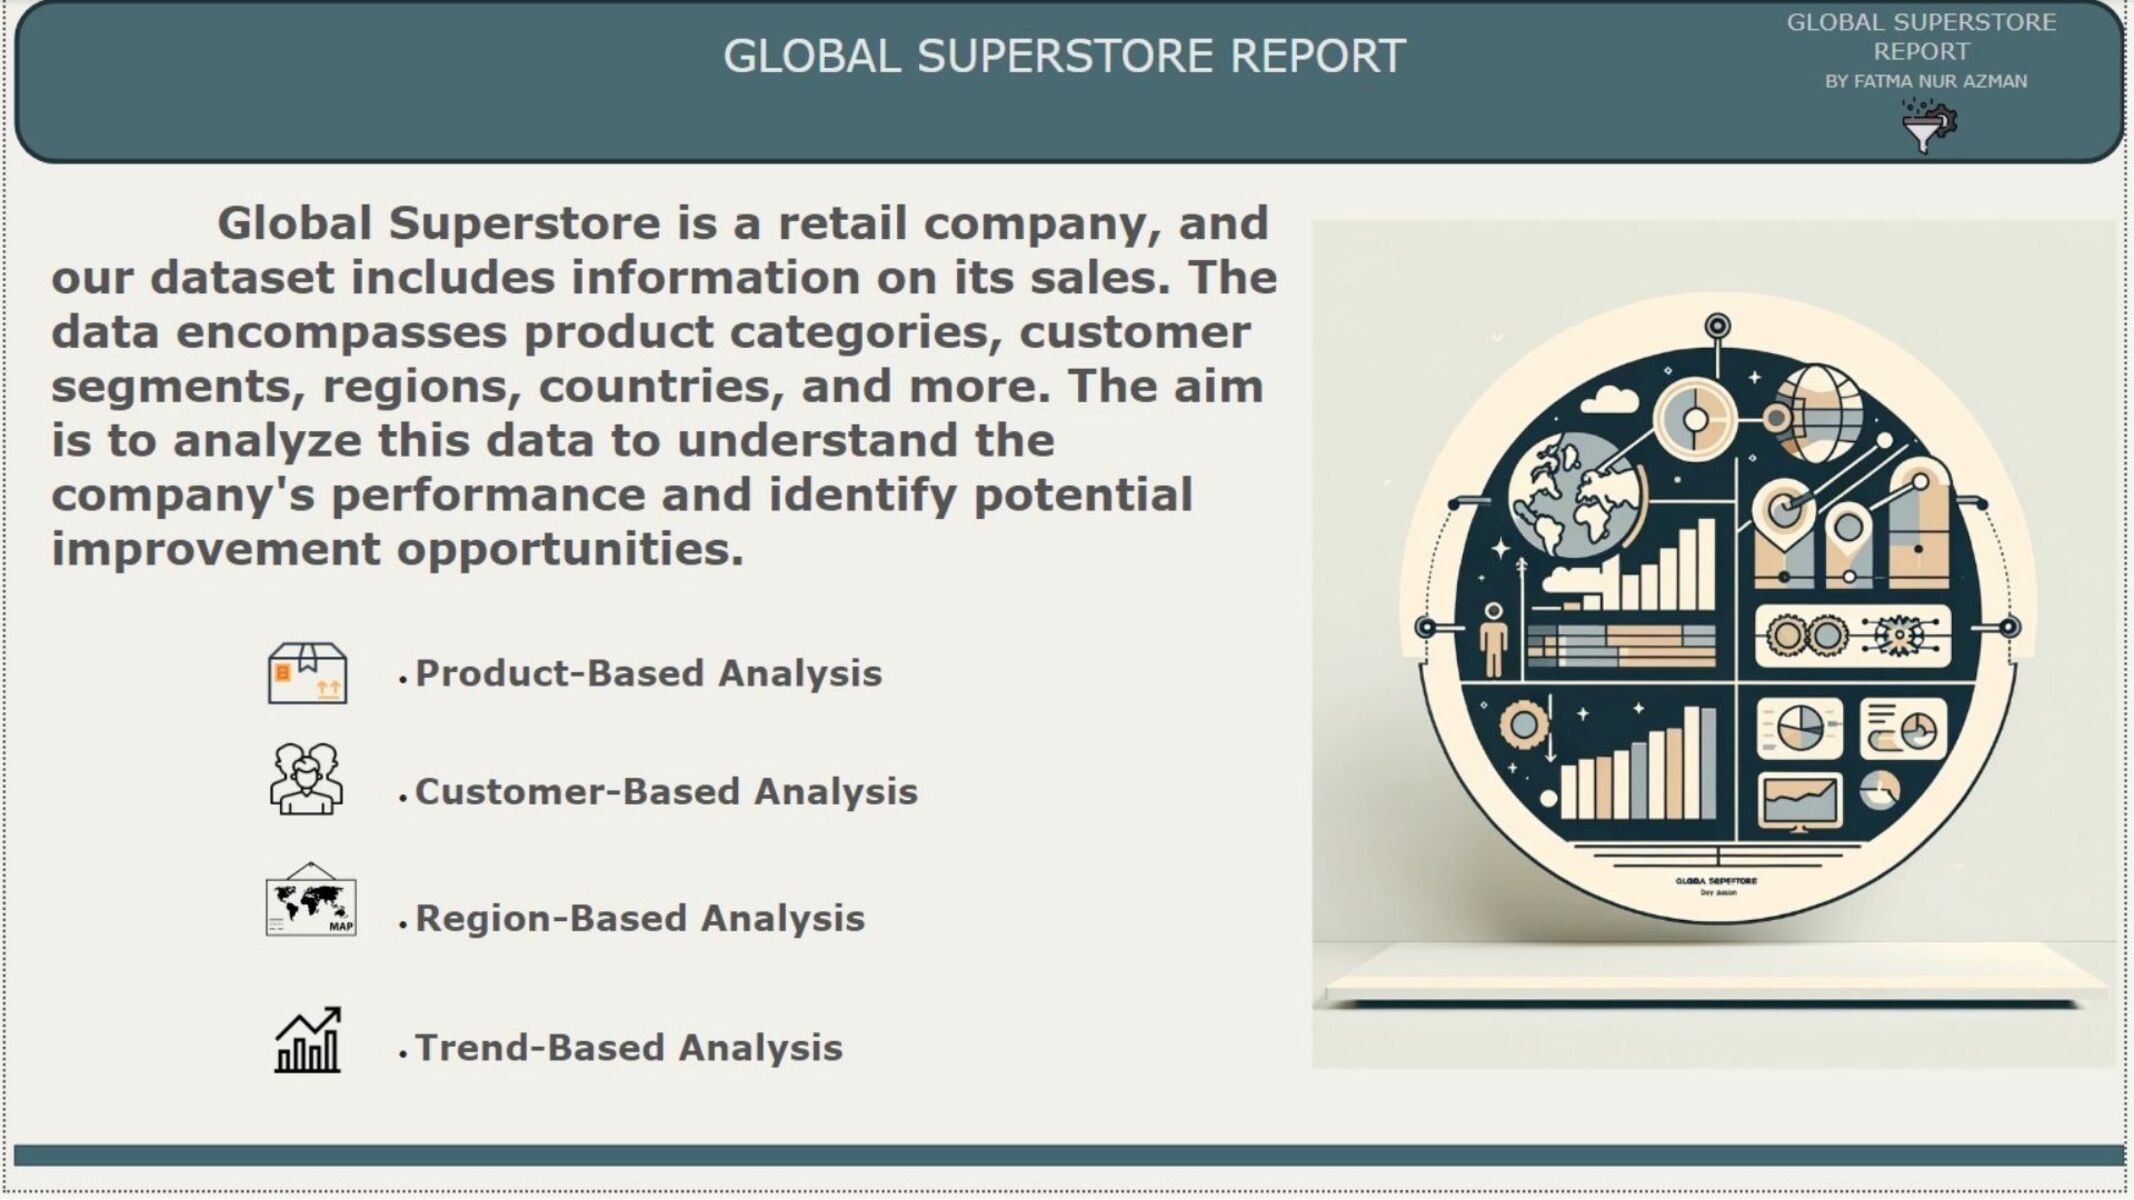
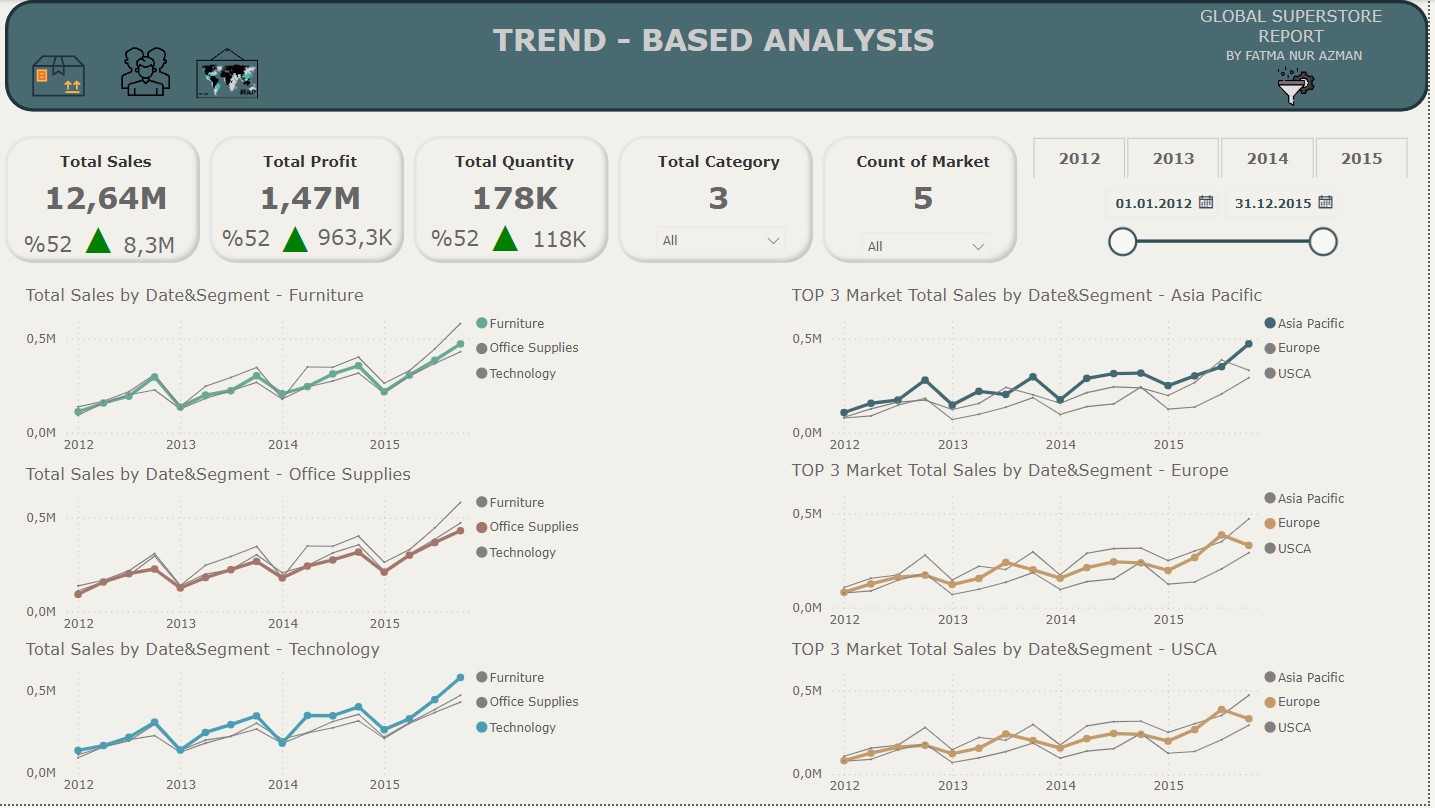
Describe: Global Superstore is a retail company, and our dataset includes information on its sales. The data encompasses product categories, customer segments,regions, countries, and more. The aim is to analyze this data to understand the company's performance and identify potential improvement opportunities.
Analysis Sections:
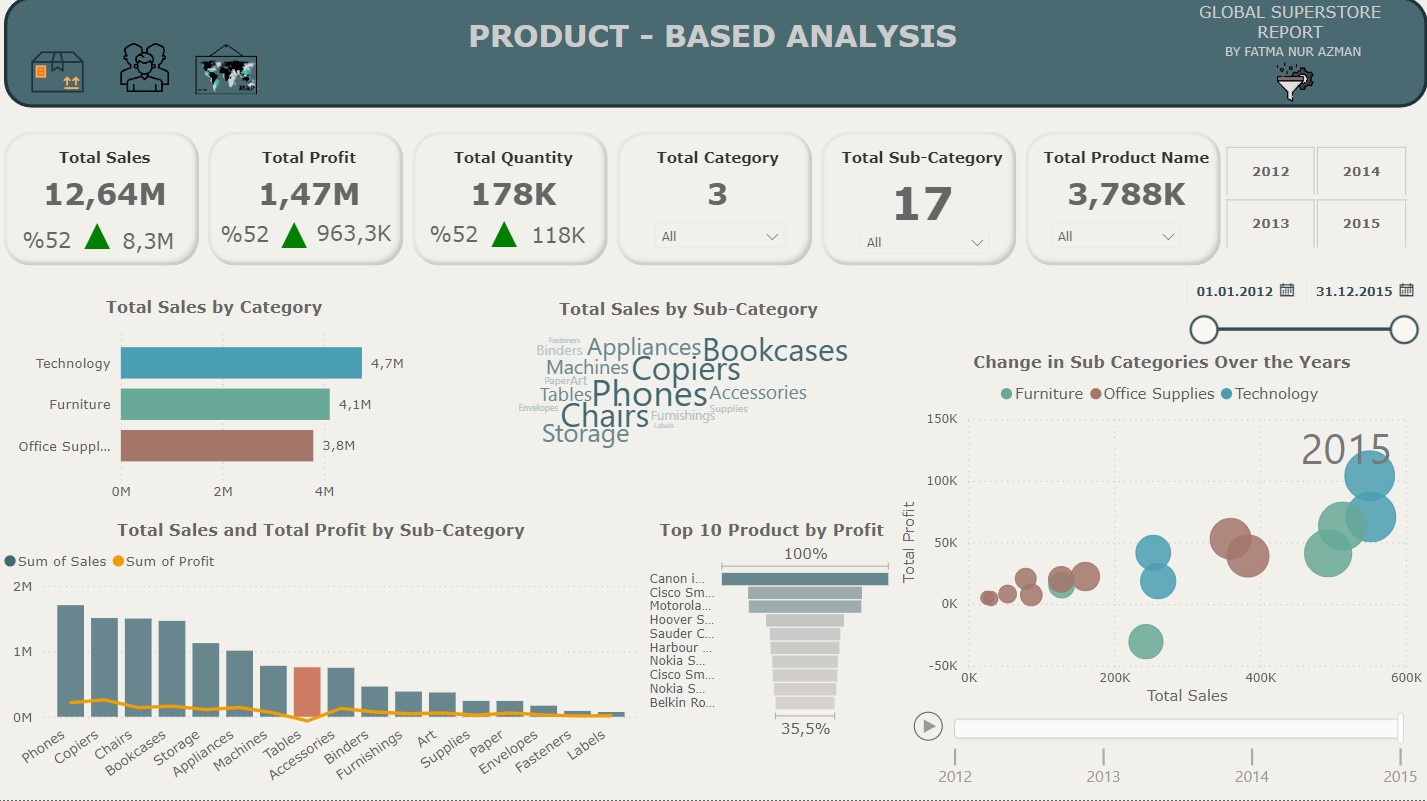
Product-Based Analysis: Evaluates the sales and profitability of different product categories.
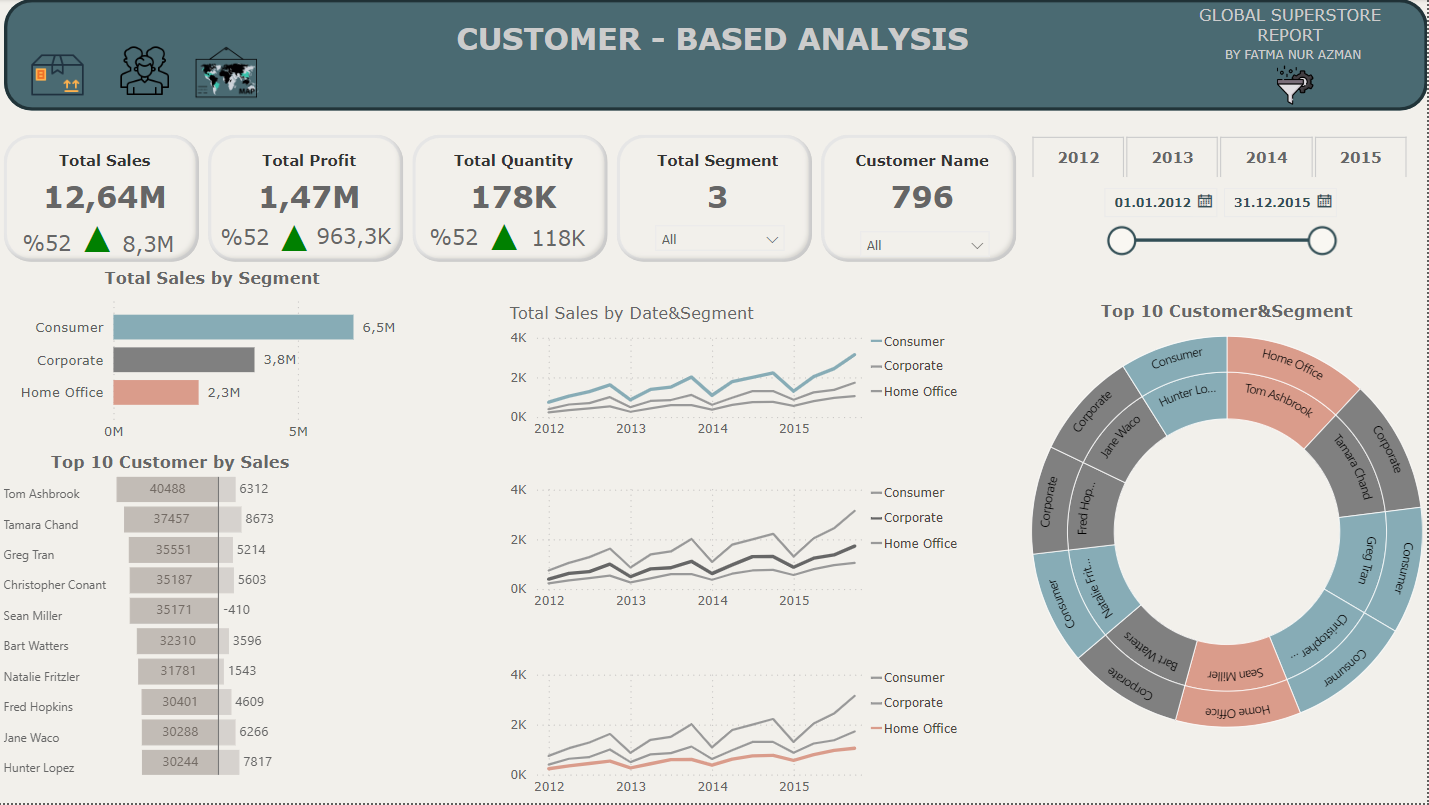
Customer Insights: Analyzes customer segments to identify high-value customers and underperforming segments.
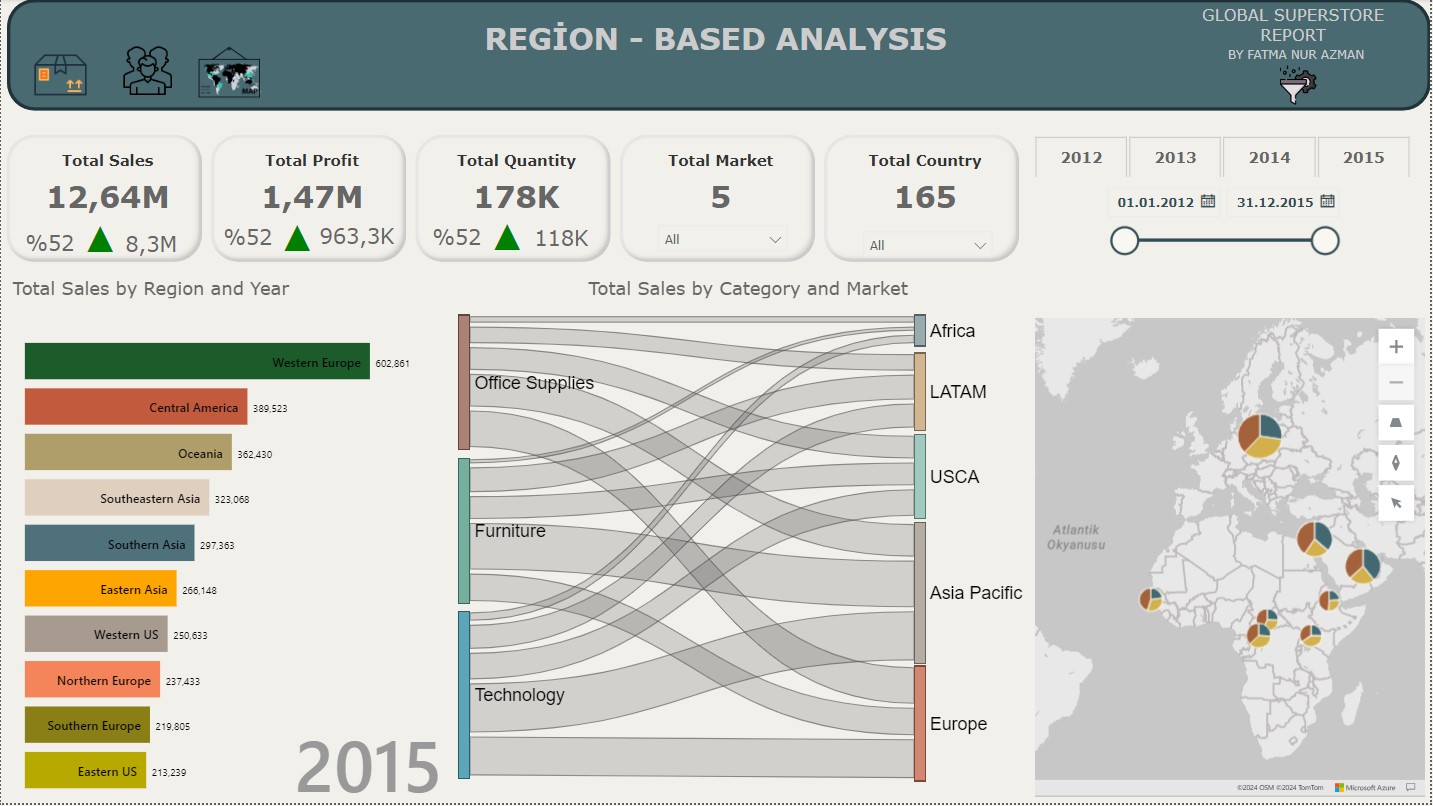
Regional Performance: Assesses sales performance across different regions.
Trend Analysis: Examines sales trends over time to highlight seasonal patterns.
GitHub Repo: Global Superstore Sales Analysis
Youtube Report Video: Global Superstore Sales Analysis Video


CAR SALES NORWAY ANALYSIS
POWER BI_PROJECT | 2024
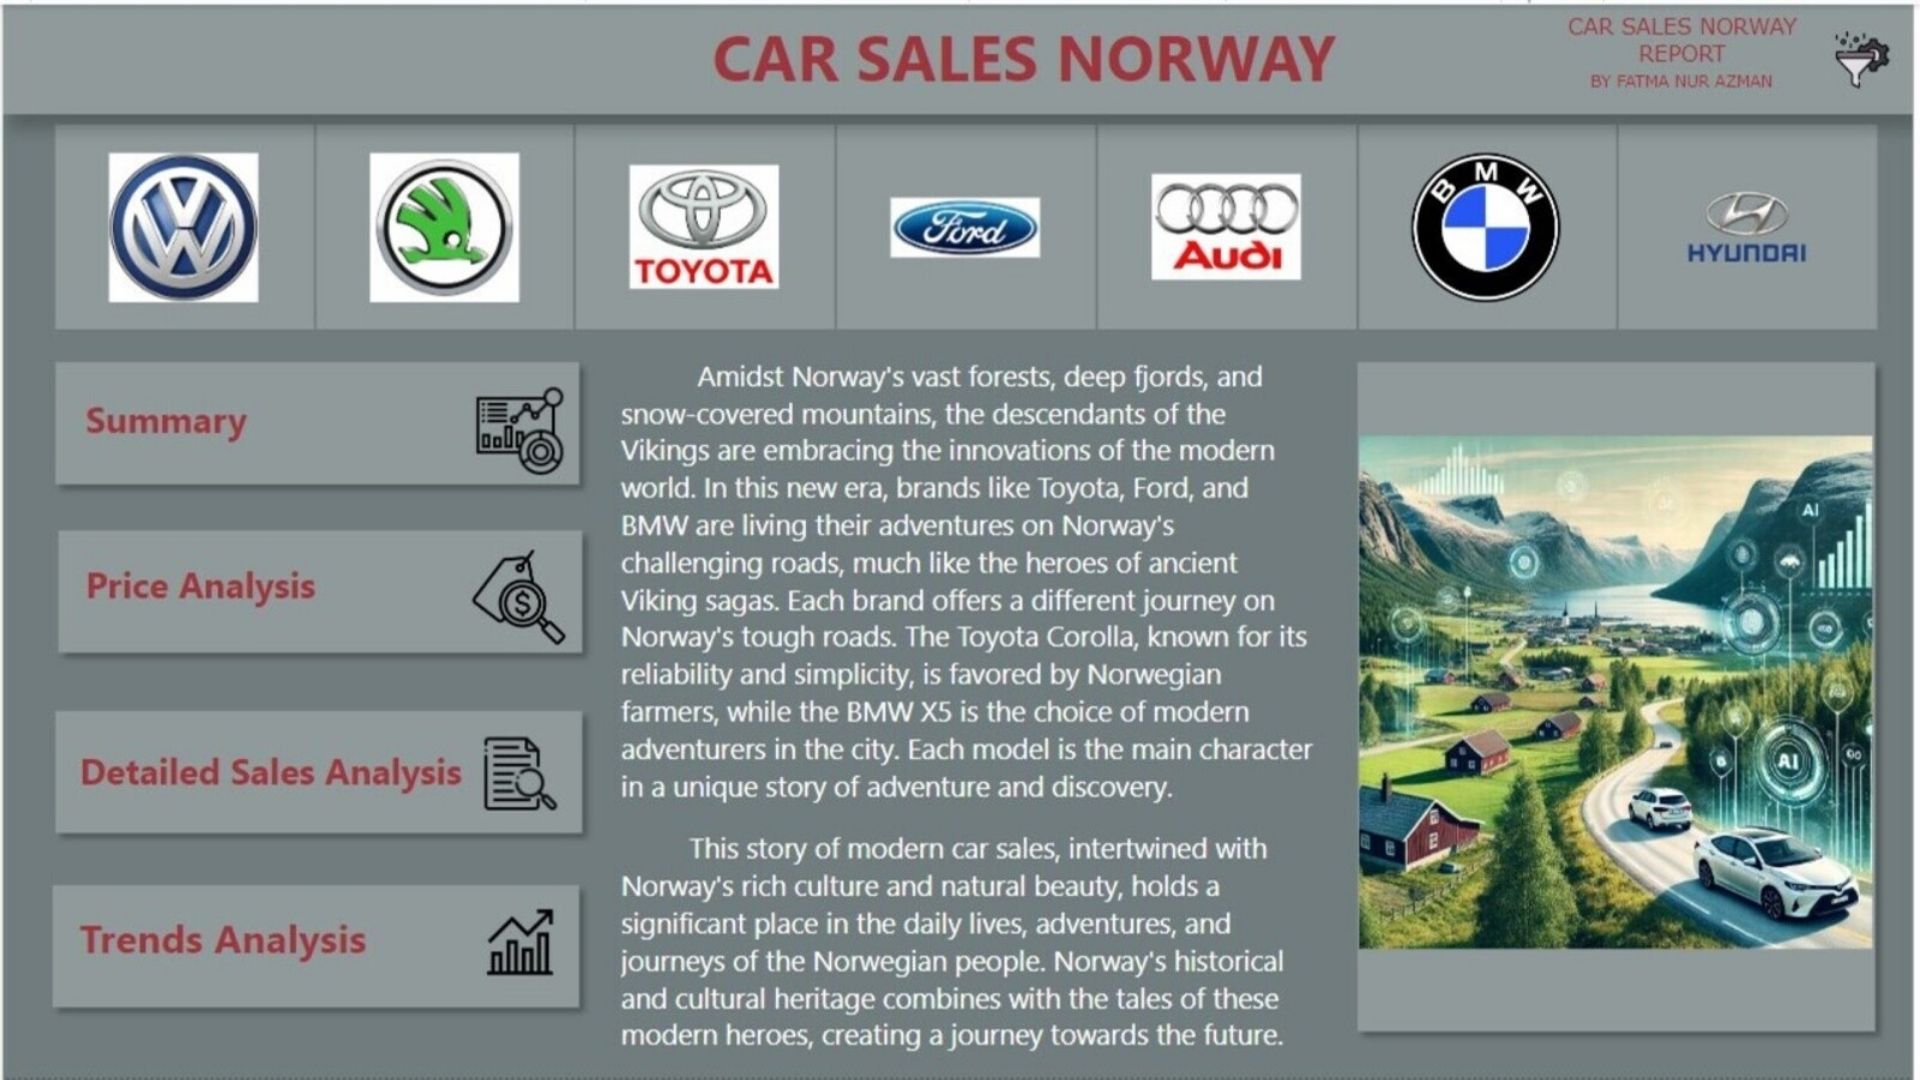
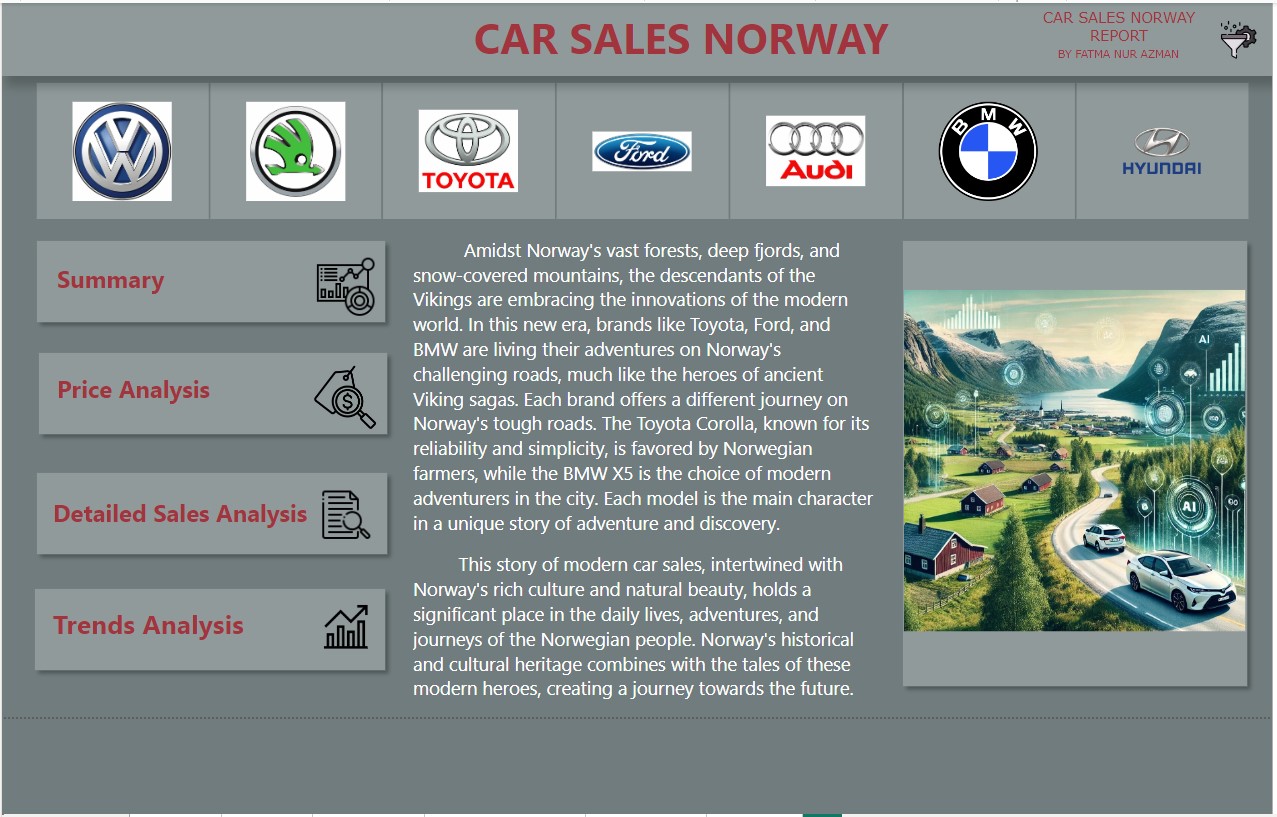
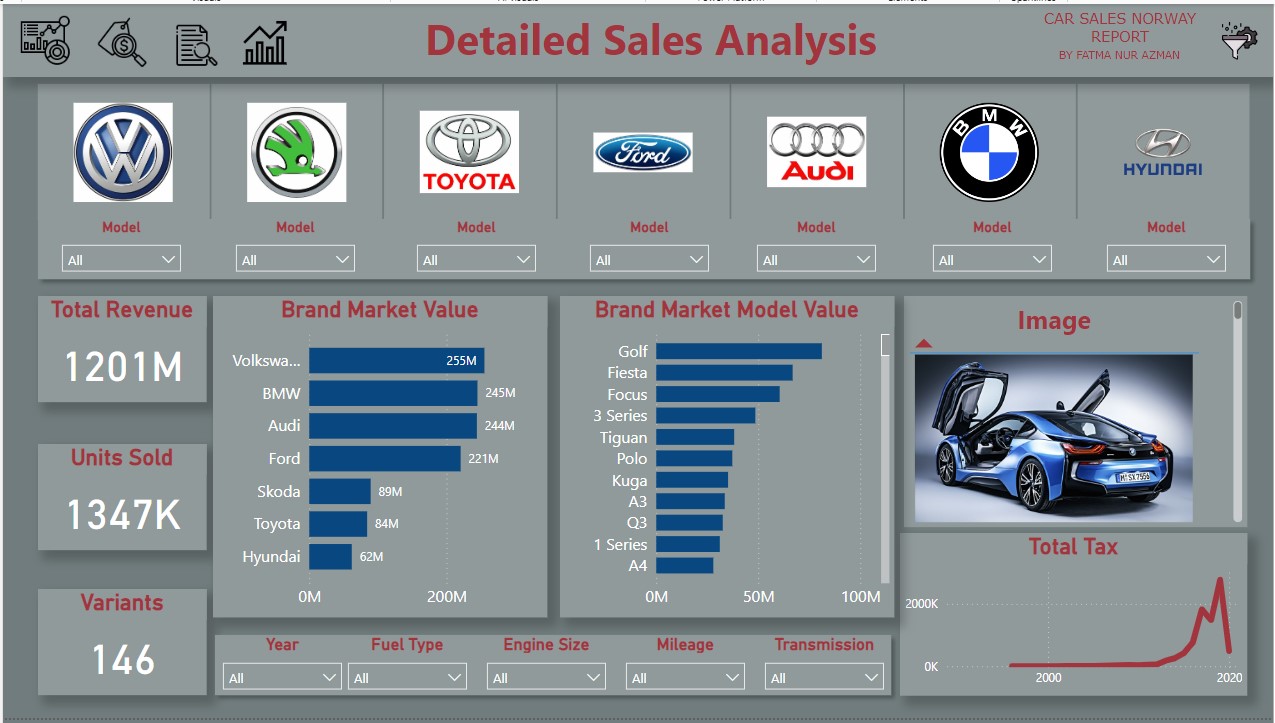
Describe: This project focuses on analyzing car sales data in Norway. The dataset includes detailed information on car models, manufacturers, market share, and revenue. The aim is to understand the performance of various car brands in the Norwegian market and identify potential insights through comprehensive data analysis and visualization.
Analysis Sections:
Overview: In Norway, the Toyota Corolla is preferred by Norwegian farmers for its reliability and simplicity, while the BMW X5 is favored by modern city adventurers. This narrative intertwines with Norway's rich culture and natural beauty.
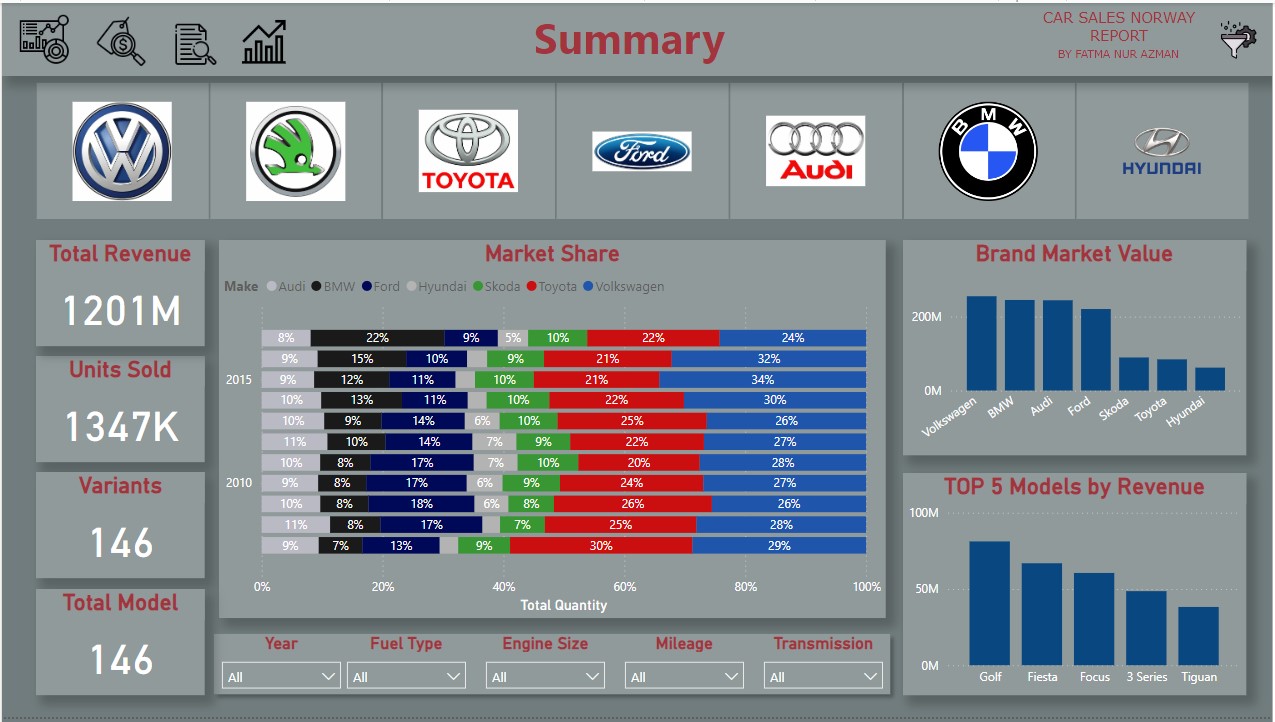
Summary:Summary information about the total revenues, units sold, and market shares of different brands is provided.Top 5 Revenue-Generating Models: Golf, Fiesta, Focus, 3 Series, and Tiguan. Market Share: Volkswagen is the leader (24%), followed by Toyota (22%), BMW (15%), Ford (10%), Audi (9%), and Hyundai (5%).
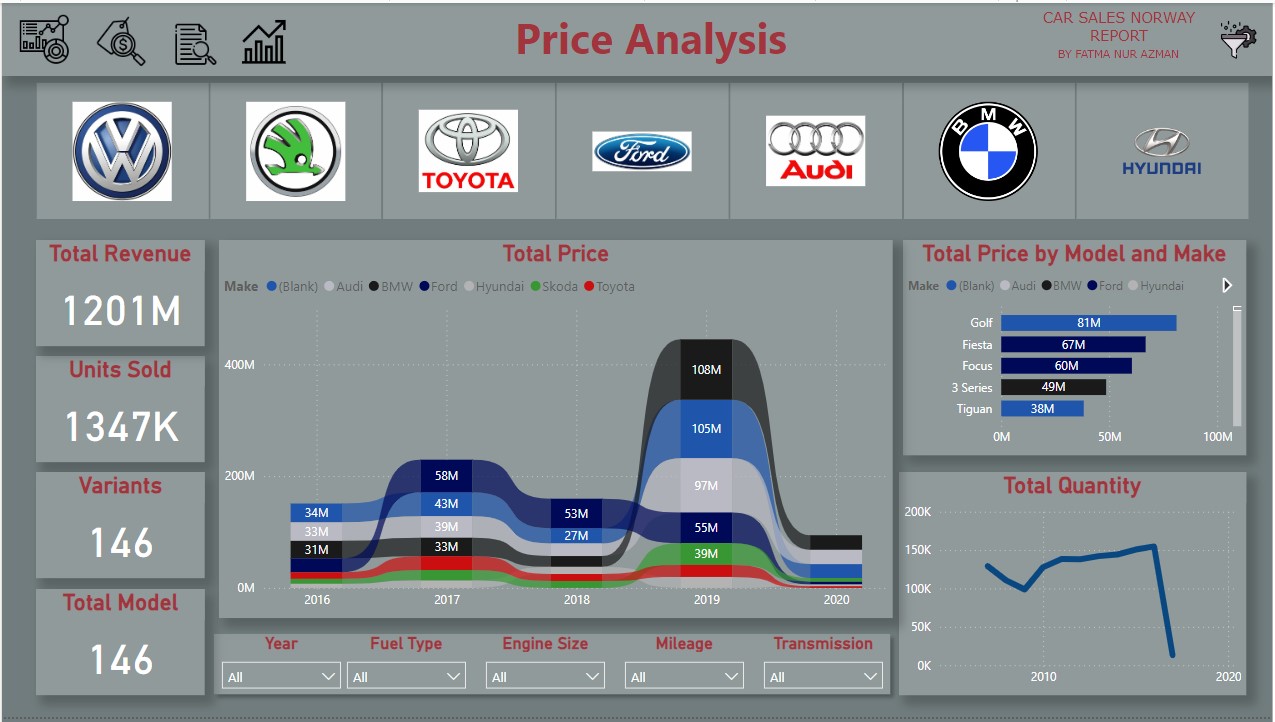
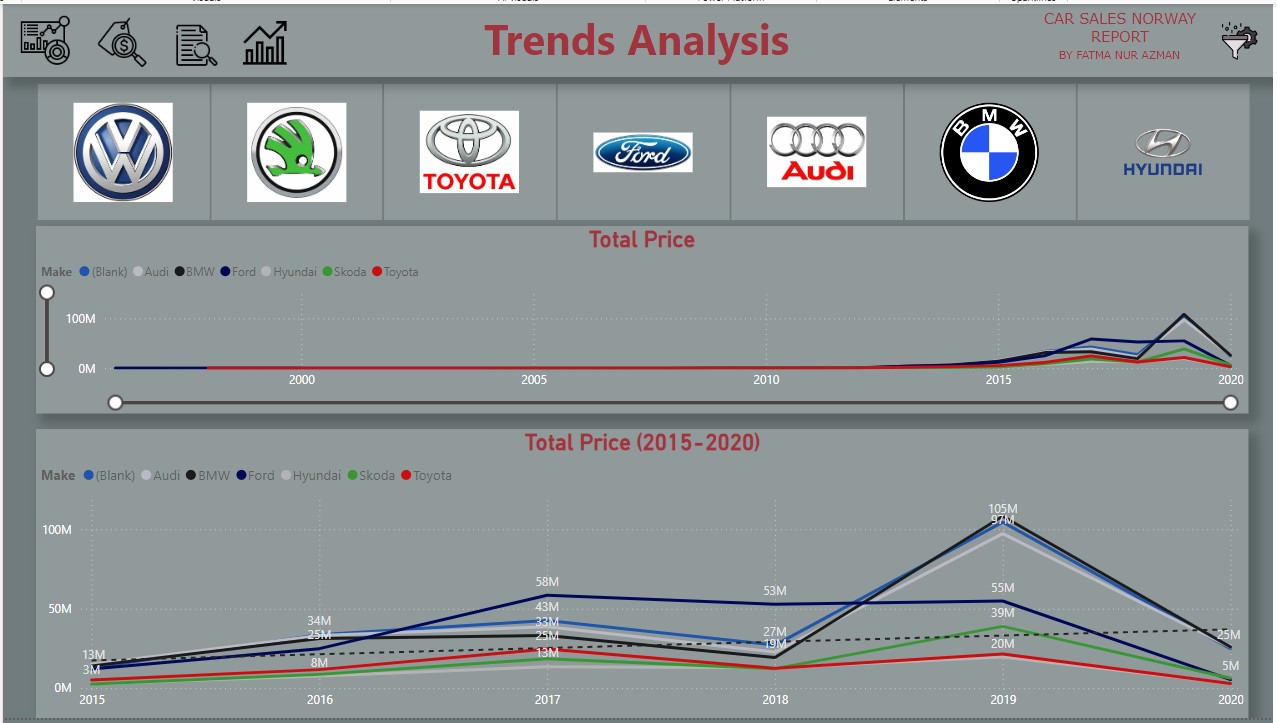
Price Analysis: Price changes of cars by years, brands, and models are analyzed.2019: The year with the highest price increases. Top Priced Models: Golf (81M), Fiesta (67M), Focus (60M), 3 Series (49M), and Tiguan (38M). Total Quantity: A significant drop is observed in 2020.
Detailed Sales Analysis:Detailed sales analysis of brands and models is provided. Top Market Value Models: Golf, Fiesta, Focus, 3 Series, and Tiguan. Total Tax: A trend of increasing total tax amounts over the years.
Trends Analysis:Trends in car prices over the years are shown. Price changes from 2015 to 2020 are analyzed in more detail.2015-2020: Price trends show significant increases and decreases for specific brands over the years.
GitHub Repo: Car Sales Norway Analysis
Youtube Report Video: Car Sales Norway Analysis Video
COVID-19 ANALYSIS
POWER BI_PROJECT | 2024
Describe:This dataset contains data collected to track the impact and spread of the COVID-19 pandemic worldwide.
Analysis Sections:
Overview: The data is collected to track the impact and spread of COVID-19 globally, used by health organizations, governments, and researchers to understand the dynamics of the pandemic and develop intervention strategies.
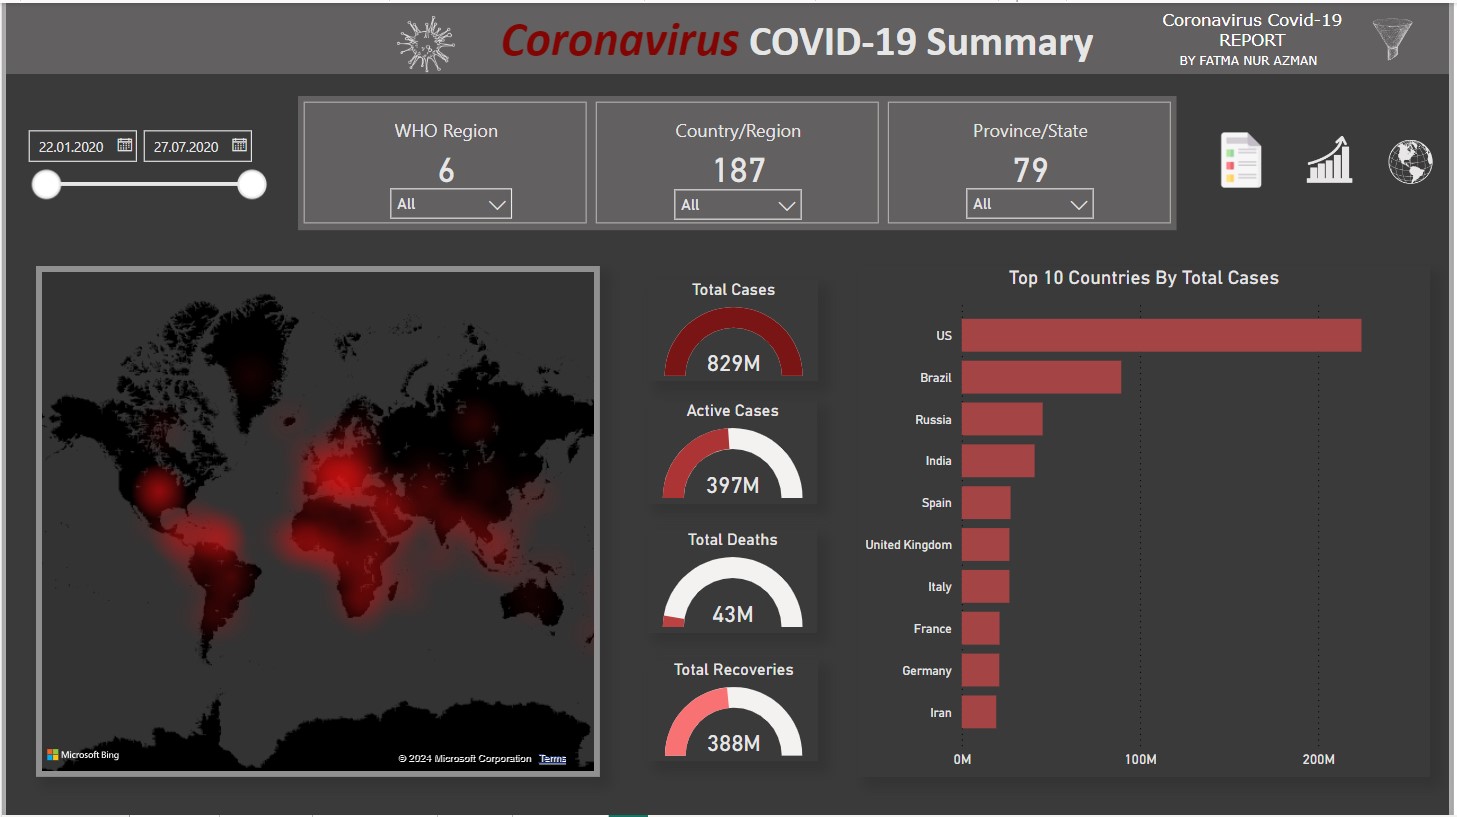
Summary:Summary information about total cases, active cases, total deaths, and total recoveries is provided. It also highlights the top 10 countries by total cases.
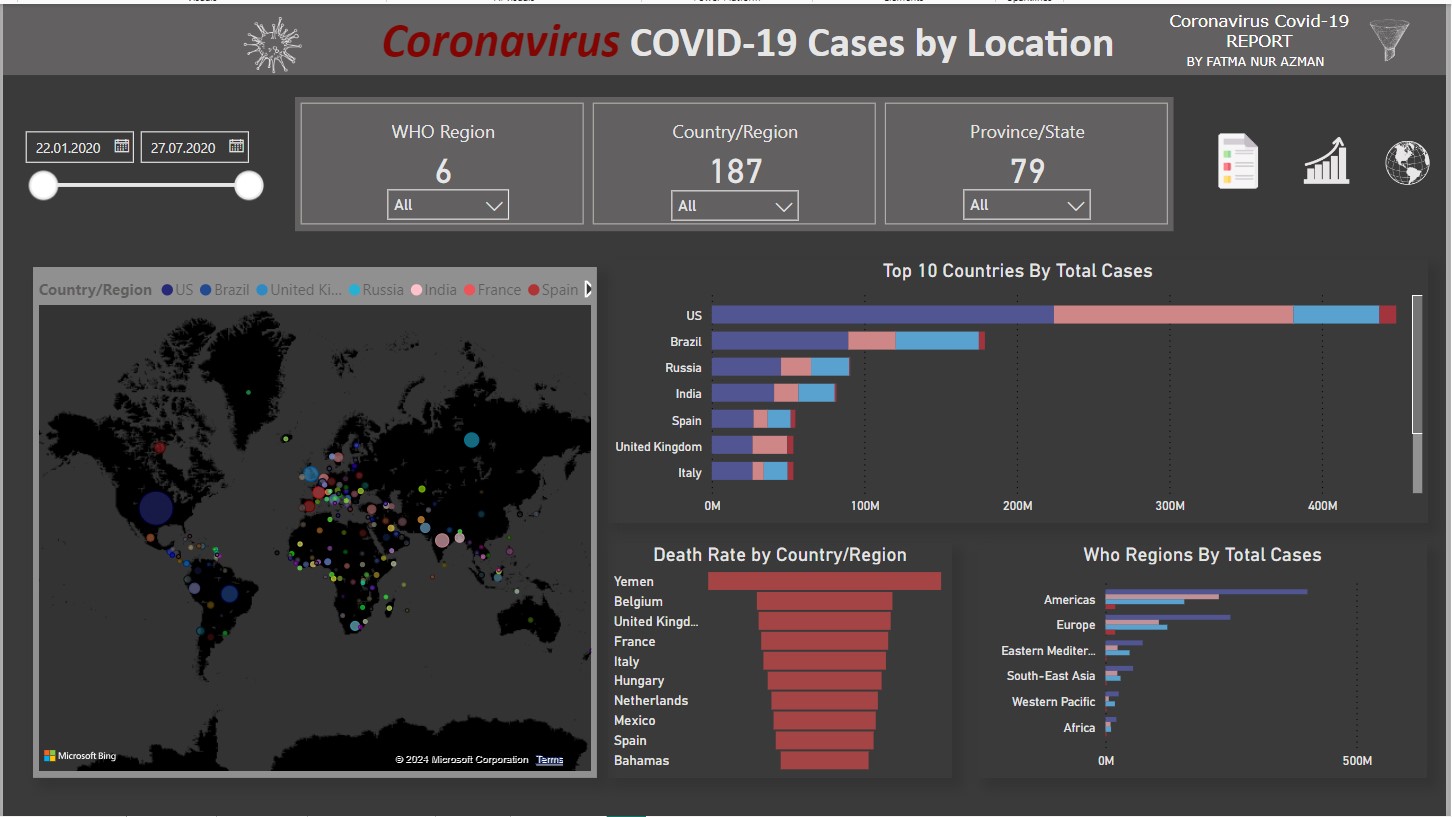
Country/Region:This dashboard breaks down COVID-19 cases by location, including WHO regions, countries/regions, and provinces/states. It also shows the death rate by country/region.Top 10 Countries by Total Cases: The US, Brazil, and Russia have the highest number of cases. Death Rate by Country/Region: Yemen has the highest death rate, followed by Belgium, the United Kingdom, and other countries. WHO Regions by Total Cases: The Americas and Europe have the highest total cases.
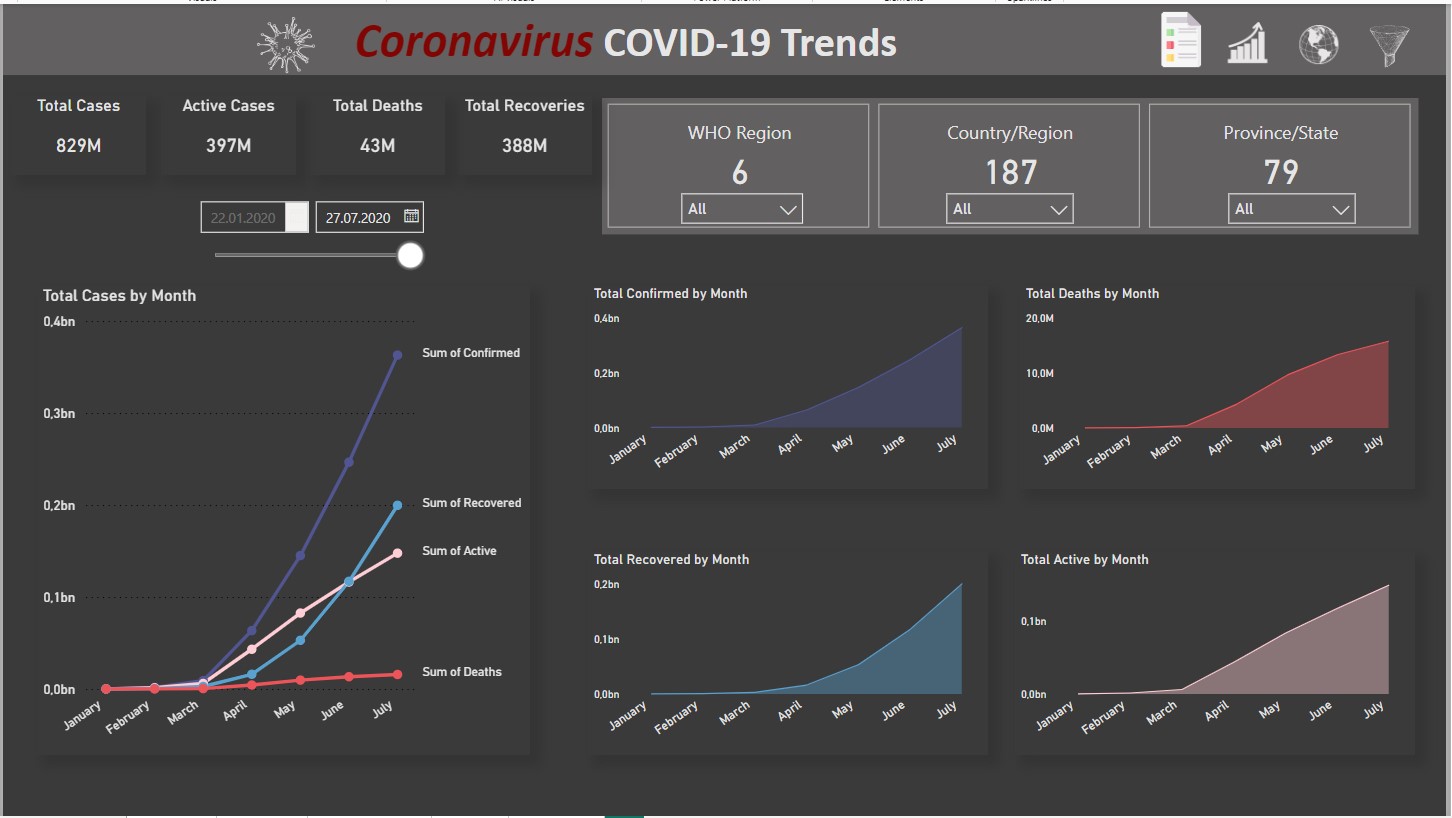
Trends Analysis: This dashboard shows the trends in COVID-19 cases, active cases, deaths, and recoveries over time.Total Cases by Month: There is a significant increase in confirmed cases, recovered cases, and active cases over time. Total Deaths by Month: The number of deaths has also increased significantly over time, peaking in certain months.
GitHub Repo: COVID-19 Analysis
Youtube Report Video: COVID-19 Analysis Video